I've searched high and low for the historical graph of KLCI PE for a long time and found nothing. I'm looking for something similar to this, the S&P 500 PE Ratio graph:

Source: http://www.multpl.com/
I rejoiced when I chanced upon this report from Maybank-IB, which provided a graph of KLCI PE. However this report is rather outdated. And I just can't find a similar recent report from Maybank-IB.
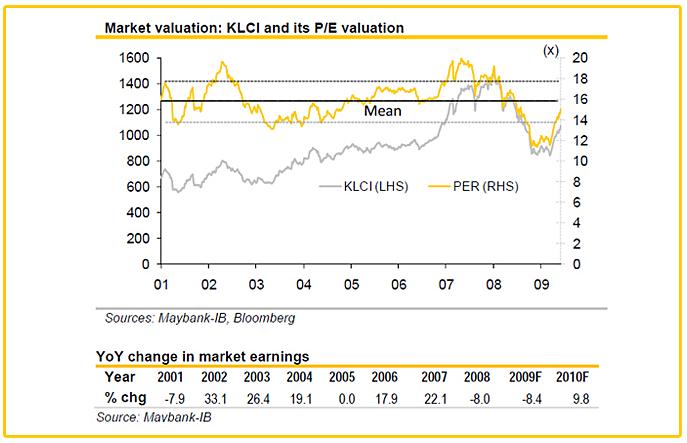
Source:Maybank-IB
Then, Public Mutual sent me this in its newsletter. Here is the most recent Bursa KLCI PE graph in its 11-Nov-2011 newsletter.

Source: Public Mutual
The information in both sources are quite identical. Average PE of FTSE Bursa Malaysia KLCI is about 16x.
During the 2008-2009 global financial crisis, the PE fell to ~11. Just to illustrate how valuation of securities fall in tandem with the confidence of the general public in the share market.
The PE of KLCI tells us that Malaysians today are still quite confident of the market. Perhaps influenced by the impending general election and the promises of ETP's effectiveness.
I do not see any reason to enter the market at this point. The upside is limited but the downside is too huge to stomach.
No comments:
Post a Comment