Showing posts with label Market outlook. Show all posts

Wednesday, February 1, 2012

The Boom and Bust of KLSE / KLCI

A financial instructor once told me, 'If you could catch the few bust n booms of the economic cycle in your lifetime, you will be rich'.
Problem is, it is very difficult if not impossible to determine the peak n trough of the cycle. Which explains why the middle-aged financial instructor is still conducting classes and not enjoying a work-free retirement.

I do not attempt to determine the peaks n troughs of the market. However, I aspire to do better than dollar-cost averaging and buying the index. I do my homework; study the market, the global economy, individual stocks & abit of technical analysis.

At this point of time, everyone is shouting 'The risk of recession is off the table', 'Market has already priced in the worst, grab them at a bargain now before they fly'. Confidence is up, China is growing better than expected, Fed may embark on QE3. Wow, with all the cheerleading, how could one not be excited and jump right back into the stock market 'while the market is still cheap'?

Maybe so for other bourses, but our own Bursa KLSE? If valuation is so cheap, I should be snapping up my favourite counters like a Mega-sale shopper rite? How come I cannot find under-valued blue chips to accumulate? Perhaps *gasp* the market is not cheap at all.

Let's investigate how KLSE fared during times of crisis.


In 1997 Asian Financial Crisis, KLSE crashed big time. From 1200 to 270, a mindbogging 78% drop. No wonder mom n pop swear off stocks forever. Can't get data on the PE, PB nor NTA dated back then.

From Asian Financial Crisis bottom at 270 around mid-1998, it chalked up a gain of 270% to the next top, dotcom.

Before the onslaught of DotCom bubble, KLSE reached 1000 points, which demanded a PE of 27. Bubble popped, KLSE tanked 40% to 600 pts. PE fell to 11.

Then it was all good and KLSE passed 1500 mark, 150% up from dotcom bottom around mid-2001.
11-Jan-2008
KLCI : 1516
PE : 22.85
P/NTA : 3.95
DY : 3.44%

Along came The Great Recession and brought the market down 40%
05-Dec-2008
KLCI : 838
PE : 11.29
P/NTA: 2.2
DY: 6.47%

2 years after the Great Recession, we enjoyed a superb recovery thanks to concerted government effort in flooding the market with liquidity.
KLSE up 86% from the lows of 2008.
22-July-2011
KLCI : 1565
PE: 16.58
P/NTA: 4.14

Then Europe and US scared the s*** out of Mr Market, and we took a tumble, KLSE down 12%.
23-Sept-11
KLCI: 1365
PE: 14.89
P/NTA: 4.16

With today's upbeat sentiment that no one is sinking into a recession and Asia will continue to grow with China leading the pack, KLCI is back with a vengence.
13-Jan-2012
KLCI: 1523
PE: 16.7
P/NTA: 5.15

You call that gloom n doom all priced in?
Once earnings start dropping in the next quarter or so, PE won't be looking so pretty. Global slowdown is a sure thing. The debate now is whether we will muddle through or slip into a recession. Both are not good.

Okay, you may argue that KLCI may go even higher. It is afterall, not at the PE ~20 range yet, and with March Election 'round the corner, KLCI will not be allowed to fall. I totally buy that argument. Perhaps that is precisely why KLCI is so over-priced.

That said, I am still pretty much risk-off as the upside is limited and all the counters I have my eyes on are above PE23 already. Buy VALUE or do nothing. 

Wednesday, November 23, 2011

Graph of KLSE/Bursa KLCI PE

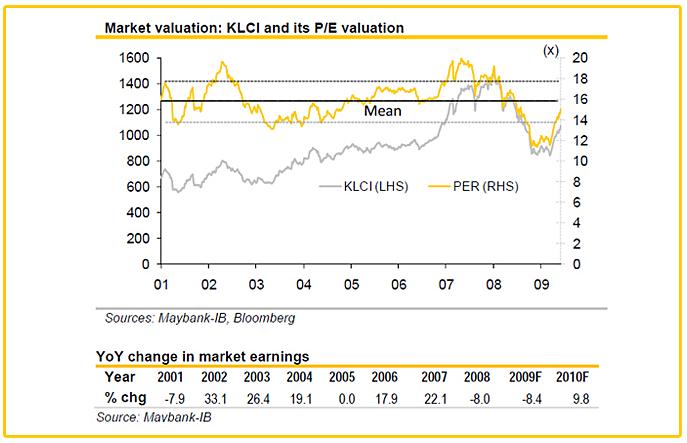
The market PE at current is about 16. And the average PE of KLCI is about 16. The market is neither undervalue nor overvalued at this point of time. But what if we fall  into a recession next year? How does KLCI PE look like in times of recession?


I've searched high and low for the historical graph of KLCI PE for a long time and found nothing. I'm looking for something similar to this, the S&P 500 PE Ratio graph:


Source: http://www.multpl.com/

I rejoiced when I chanced upon this report from Maybank-IB, which provided a graph of KLCI PE. However this report is rather outdated. And I just can't find a similar recent report from Maybank-IB.


Source:Maybank-IB

Then, Public Mutual sent me this in its newsletter. Here is the most recent Bursa KLCI PE graph in its 11-Nov-2011 newsletter.

Source: Public Mutual

The information in both sources are quite identical. Average PE of FTSE Bursa Malaysia KLCI is about 16x.

During the 2008-2009 global financial crisis, the PE fell to ~11. Just to illustrate how valuation of securities fall in tandem with the confidence of the general public in the share market.

The PE of KLCI tells us that Malaysians today are still quite confident of the market. Perhaps influenced by the impending general election and the promises of ETP's effectiveness.

I do not see any reason to enter the market at this point. The upside is limited but the downside is too huge to stomach.

Tuesday, November 15, 2011

Macro Outlook 15 November 2011


I'm no economist. My opinions on the macroeconomy are totally unqualified.
All my writings on macro outlook are based on the materials I read, and seminars/talks I attended.
I started out as a strong fundamental supporter; looking only at the fundamentals of the company. Dissect its balance sheet, P&L and cash flow statements. Look for economic moats, competitive advantages. Do not ever try to time the market because no one can and forget about technical analysis because it's tea leave reading.
Although I still strongly advocate Fundamental Analysis and use it for every stock purchase, I do not brush aside the macroeconomic factor. I do admit that I don't favor riding out a recession. I'd rather be in cash position and buy when valuation is cheap.

The Euro crisis.
There have been enough can kicking going on and half-baked solutions. Filter out the noise from Wall Street analysts who are desperate to hang on to every glimmer of hope. Let's look at the situation realistically.
Greece's sovereign debt problem is no where near being addressed. Harsh austerity imposed on Greece is pushing the country deeper into recession and killing its chance of growing.
ESFS is too small to build a ring fence around troubled nations. Not even the most complex financial engineering, boosting its fire-power to 1 trillion can help. Much of its funds is already committed to bailing out the PIGS (Portugal, Ireland, Greece, Spain). Bring in Italy, and ESFS looks more like a pea-shooter than the bazooka it is supposed to be.
Italy. It is too late. The Euro zone leaders have done too little too late to stem the contagion of PIGS debt crisis. The bond yield of Italy has reached a frightening level of >7%, shouting for a bail-out, if not for ECB stepping in to buy its bonds to bring down yields. It is now 6.76% yield for government 10-year bond. If it maintains at this level, Italy's debt is not sustainable. It cannot afford to roll over its debt at this rate for long.

Interest Rates, Inflation & QE
Interest rate in the US is already at near 0%. The Fed can't further lower rates to stimulate the economy.
Inflation (US), no thanks to QE 1 & 2, is at approximately 4%. A QE3 will further drive up inflation. When inflation flares, consumer confidence is affected as their spending power decreases.
US unemployment rate is stubbornly stuck at 9%.
Inflation in emerging economy powerhouses, China and India is high, over 6%. India has been increasing interest rates numerous times to stem inflation and dampening growth in the process. China, on the other hand, cannot be depended upon to stimulate a flagging economy, hoisting the world economy out of recession this time around as it will not simply embark on fiscal spending at such inflation level.

With Euro zone slipping into recession and US looking set to follow suit, I do not believe that Malaysia will not be affected, despite what our politicians say. Strong domestic demand, ETP.. all bull.. I'm not buying it. I'm bracing for an imminent downturn.

I shall end this post with a chart from OECD.

OECD composite leading indicators continue pointing to slowdown in economic activity
Source: oecd.org

Monday, November 14, 2011

KLCI Market Trend Using Technical Analysis

Technical analysis is my weakest among the 3 areas I look at for my stock investment. I don't use it to speculate in momentum stocks but more for a feel for the overall medium to long term trend. I use a few indicators but these may change as I find others which better serves me.

Here's a snapshot of KLCI over 1-year taken on 11-Nov-2011.
Source: Barchart and Tradesignum


1. Simple Moving Average, SMA
The most useful indicator of the lot.
SMA(50) line has not crossed SMA(200).
Price has broke about SMA(400) but is still below SMA(200).
Until the index convincingly break above the SMA(200) line at 1509, we are still not quite bullish yet.

2. Moving Avg Convergence Divergence (MACD)
MACD shows very bullish signs.
Both the signal lines are above the 0-mark with blue-line crossed over red-line.

3. Slow Stochastic Oscillator
Slow Stochastic Oscillator is strongly bullish.
Blue line crosses above 50-mark from 20-mark moving towards 80-mark

4. Parabolic SAR
Price is currently above Parabolic SAR. A buy sign.

It appears that 3 out of 4 indicators show bullish signs. However, I place higher importance on SMA and the fact that SMA(200) which is a very crucial line,has not been broken, makes it very difficult for me to be bullish. And this is looking at Technical indicators alone. Bring in the macroeconomics and I'm pushed back into the bear region. The best I can call the October upshot is a bear rally. Use this chance to exit long positions and hold tight to dear cash.