Petronas Dagangan is the principal domestic marketing arm of Petroliam Nasional Berhad (PETRONAS) for downstream petroleum products. Think Petronas gas stations,Kedai Mesra and the cooking gas cylinders in the kitchen.
Retail (50%) and Commercial business(31%) contributes 81% of Petdag's net margin.
Retail is the key business, contributing almost 50% of group's net margin.
Retail market share maintained at 32%.
995 service stations. 617 Kedai Mesra. 22 new service stations in FYE2011.
Plans to continue expanding service station network as it aims to take market leadership.
Non-fuel income, Kedai Mesra, increased 14% from last year.
Commercial Business’market leadership of more than 60%. Contributes 31% of Petdag's net margin.
Commercial Business sales volume grew 3.8%. Prominent in aviation sector.
Dominant market share of 70% at KLIA and other major airports.
Market leader in LPG (50.7%)
Lubricant market share 22%.
Sale volume improved by 9%.Partnership deals with Proton Edar, Naza Chevrolet, Cycle & Carriage and Perodua to supply lubricants.
Growth in FYE2011
Retail- Maintain
Commercial -3.8%
Lubricants - 9%
LPG - 2%
Management has the ambition to take market leadership in 2-5 years time.
How?
Improve service in retail arm.
For commercial business, concentrating on new opportunities coming out of the economic development corridors under the 10th Malaysia Plan and the government’s Economic Transformation Programmes (ETPs).
For LPG, which is matured market, Petdag will include innovative marketing and tighter cost control.
Petdag took a hit in 2009, effects from the Great Recession; earnings declined as much as 12%. The oncoming global recession 2012 doesn't bode well with this stock. The commercial chunk contributes quite significantly to Petdag's bottomline. Aviation isn't gonna take off to high grounds in such gloomy economy. The best outcome is very slow growth in the US. Recession is already a sure thing in Europe.
Moreover, Petdag at 17.20 is rather over-valued. It factors in high growth rate which I don't think is achievable under such unfavorable economic conditions.
The growth story by the management doesn't even jump at you. Nothing major happening. Just improving services and operations.
Overall, I like Petdag, but not at its current valuation.
Update, 30-Jan-2012
http://www.theedgemalaysia.com/highlights/200078-2012-ceo-outlook-series-pdb-to-boost-presence-beyond-msia.html
In 2012, Petdag will explore growth beyond Malaysia, starting with regional opportunities that will complement commercial goals.
Showing posts with label Fundamental Analysis. Show all posts
Showing posts with label Fundamental Analysis. Show all posts
Monday, January 9, 2012
Sunday, December 4, 2011
Carlsberg - Fundamental Analysis
In Carlsberg, The Story ,Carlsberg Brewery Berhad appears to have a more exciting outlook than Guinness Anchor Berhad. Let's see if the figures support the story.
EPS & Revenue Growth

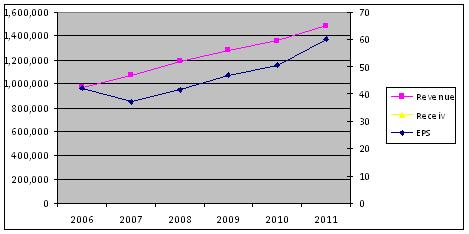
From the divergence of the EPS and Revenue chart lines, we can see that the profit margin of Carlsberg is being squeezed prior to 2009.
Both revenue and profit increased tremendously after the acquisition of Carlsberg Singapore in 2009.
Financial year end of Carlsberg Bhd is 31 Dec.
This is how it has performed this year, 2011.
Q1 Q2 Q3
Revenue 407215 345512 4101661
EPS 16.01 10.15 15.98
EPS for 3 cumulative quarters sums up to 42.14, almost reaching the EPS of Year 2010. Achieving 20% growth in 2011 is at hand.
Gross profit margin in 2010 is 34%, compared to GAB 31%.
ROE at 23% is a big improvement over the previous 8 years of under 20% return on equity.
Carlsberg doesn't have to spend big on Capex, 23mill in 2010. Depreciation is a single digit %.
Free Cash Flow yield (FCF) at 8% is outstanding.
Retained earnings is also building up
2006 2007 2008 2009 2010
323.3 319.1 316.0 363.5 438.2
Gearing
Carlsberg has no long term debt. It has some short term debts tho.
DE ratio 0.6.
At time of writing, 1-Dec-2011,
PE : 17.13
PEG: 1.47
Compared to GAB (I'm using GAB instead of the industry because there are only 2 players!), having PE 18 and PEG >2, Carlsberg share price bodes better with me.
DCF computes a fair value of 8.18 for Carlsberg.
Without thorough analysis of these 2 breweries, I'd have gone for GAB due to personal preference for its beer. Now, I lean towards Carlsberg if I have to choose just one to buy.
EPS & Revenue Growth

From the divergence of the EPS and Revenue chart lines, we can see that the profit margin of Carlsberg is being squeezed prior to 2009.
Both revenue and profit increased tremendously after the acquisition of Carlsberg Singapore in 2009.
Financial year end of Carlsberg Bhd is 31 Dec.
This is how it has performed this year, 2011.
Q1 Q2 Q3
Revenue 407215 345512 4101661
EPS 16.01 10.15 15.98
EPS for 3 cumulative quarters sums up to 42.14, almost reaching the EPS of Year 2010. Achieving 20% growth in 2011 is at hand.
Gross profit margin in 2010 is 34%, compared to GAB 31%.
ROE at 23% is a big improvement over the previous 8 years of under 20% return on equity.
Carlsberg doesn't have to spend big on Capex, 23mill in 2010. Depreciation is a single digit %.
Free Cash Flow yield (FCF) at 8% is outstanding.
Retained earnings is also building up
2006 2007 2008 2009 2010
323.3 319.1 316.0 363.5 438.2
Gearing
Carlsberg has no long term debt. It has some short term debts tho.
DE ratio 0.6.
At time of writing, 1-Dec-2011,
PE : 17.13
PEG: 1.47
Compared to GAB (I'm using GAB instead of the industry because there are only 2 players!), having PE 18 and PEG >2, Carlsberg share price bodes better with me.
DCF computes a fair value of 8.18 for Carlsberg.
Without thorough analysis of these 2 breweries, I'd have gone for GAB due to personal preference for its beer. Now, I lean towards Carlsberg if I have to choose just one to buy.
Thursday, December 1, 2011
Carlsberg, The Story
There are only 3 listed companies under the sub-sector of Breweries in KLSE/Bursa Malaysia. Guinness Anchor, Carlsberg and the third is a distributor of wine. Napex, which brews Jazz and Starker(served at the very popular Overtime chain of pubs) is not listed.
Since I have covered Guinness Anchor Berhad (GAB) here, here and here, I might as well do it for its strongest competitor. Yea, That Calls for a Carlsberg.
Carlsberg Breweries Berhad is a direct competitor of Guinness Anchor Berhad, for it does the same thing. Brews, markets and distributes beer,stout and shandy. Its product line up is more extensive compared to GAB, which has 10 brands. Carlsberg has more than double.
Beer Brewed Locally
Carlsberg
Skol
Tuborg (Premium Beer)
Stout Brewed Locally
Danish Royal Stout
Connor's (Premium Stout)
Super Premium Beer
Kronenbourg 1664
Imported Beer
Corona
Tetleys
Non-alchoholic Produced Locally
Nutrimalt
Jolly Shandy
By subsidiary
Luen Heng F&B Sdn Bhd
Becks
Budweiser
Crown Lager
Foster's
Franziskaner
Hoegaarden
Lowen Brau
Pure Blonde
Victoria Bitter
Warsteiner
Stella Artois
Leffe
Erdinger
Asahi
By Joint Controlled Entity
Cottingham & Co Ltd (Taiwan)
Beers, spirits, and alcoholic beverage
Beers include lagers, ales, dark beers, wheat beers and stouts.
Brands are Carlsberg,Corona Extra, Erdinger, Guinness, Kronenbourg 1664 and Tetley's
Also distributes Glenfarclas single malt Scotch whisky
By Associate Entity
Lion Brewery (Ceylon) in Sri Lanka
Lion Lager, Carlsberg, Strong Beer, Special Brew and Lion Stout.
Carlsberg Malaysia has presense in countries outside Malaysia unlike GAB which only operates in Malaysia.
Wholly owned subsidiaries of Carlsberg Malaysia are Carlsberg Marketing Sdn Bhd & Carlsberg Singapore Pte Ltd.
Carlsberg Msia has a 70% stake in Luen Heng F&B Sdn Bhd.
Carlsberg Malaysia makes its presense in Taiwan via jointly controlled Entities, Carlsberg Distributors Taiwan Limited ('CDTL') 50% and Carlsberg Cottingham 75%. In Sri Lanka, Carlsberg Malaysia has an investment of 24.6% in Lion Brewery (Ceylon) PLC.
How do these entities contribute to Carlsberg Malaysia Bhd's bottom line?
Operations in Malaysia contributes to 71% of profit. Singapore 29%. And others made a loss of 2 million in 2010.
In term of revenue, Malaysia contributes 76%, Singapore 23% and others 1%.
My discussion hereafter will focus on Carlsberg Malaysia and Singapore.
Mainstream beer accounts for 80% of its revenue. Premium beer, 10% of revenue, will be the segment targetted for growth. 3 years ago, Carlsberg has less than 5% market share in the premium beer segment. Now, Hoegaarden and Kronenbourg have a market share of 20% in premium beer market. MD Soren Ravn expects its premium beers to account for 40% of revenue within the next 3-5 years once Carlsberg starts brewing them in-house. The plan is to brew 2 premium brands in 2012. My guess is Hoegaarden and Kronenbourg. Makes better sense right?
How does brewing premium beer in-house translate into higher earnings?
First, Carlsberg saves on logistics costs. Second, it enjoys an exemption of RM5 per litre on import duty.
By the way, GAB brews Kilkenny locally.
In Oct 2009, Carlsberg Berhad acquired Carlsberg Singapore for 370 million. Carlsberg Singapore has 20% share of the beer and stout market in Singapore. It is at second position after market leader Asia Pacific Breweries (APB) that commands 63% market share. Tiger rocks Singapore. Annual beer consumption per person is 20 litres which is surprisingly the same as Malaysia. I had the impression that Singaporeans party harder and thus guzzle more beer.
The million dollar question... Can Carlsberg Singapore wrestle away some market share from APB? It has doubled its market share from 10% in the 1990s to 20% currently. Garnering more market share is an uphill battle due to strong branding of Tiger in Singapore. Let's just assume Carlsberg Singapore maintains its market share of 20%, Carlsberg Bhd still enjoys some upside of synergy in marketing and better utilization of capacity at its Shah Alam brewery. I'll be keeping an eye on Carlsberg Singapore growth.
Dividend and share price
Carlsberg is a dividend stock. Dividend payout took a beating in 2008 and 2009 due to the acquisition of Carlsberg Singapore, draining its coffers dry. Last year, 2010, gross dividend yield was 4%. And this year, total of 0.555 of dividend has been distributed. Gross yield of 7% at current market price of 7.25. Welcome back to the dividend camp Carlsberg.
CAGR of Carlsberg from 2007-2011 is 14.35%. A little lower than GAB at 19%. But still a fantastic return none the less.The trend of Carlsberg's stock price is somewhat similiar to GAB. Resilient and rising steadily.
Major event in 2012 is the UEFA European Cup, of which the group is the official sponsor. Drink up people.
Like GAB, Carlsberg also faces the problem of increasing costs of raw material, mainly malt which accounts for 30% of total raw material costs. Carlsberg counters by hedging up to 85% of its 2012 malt requirements.
Brewers escaped an excise hike in Budget 2011. But there is still a risk of off-budget duty hike.
However, Carlsberg has been able to pass costs to consumer. A raise of 3-5% in price may happen in year 2012 and is likely not to affect sales.
In Summary
The story on Carlsberg is a tad more interesting than Guinness. Carlsberg sells a wide range of beer. It makes sure there is beer for every segment of consumer out there. Carlsberg has also more potential to increase its profit. First, its plan to brew 2 premium beer in-house. Second, at 20% market share, Carlsberg Singapore has room to grow. In the stout segment, we can forget about Royal Stout. Stout here goes unanimously with Guinness. I favor the story on Carlsberg as there is more to look forward to.
Tuesday, November 22, 2011
Guinness Anchor Berhad, GAB - Fundamental Analysis
In GAB The Story, I ended with the remark steady growth but nothing explosive. To illustrate this statement, I charted out the EPS(Earnings per share) and Revenue of GAB from 2006-2011. FYI, financial year end for GAB is 30-June.

So preditable that I can almost draw a straight line into future projection. Notice how the 2008 global financial crisis didn't hamper earnings.
Profit margin at 31% is decent. Carlsberg is at 30-ish% as well.
Operating expenses for SGA (Selling, general & administrative) rose 30% from previous year. At 49% of gross profit, SGA expense is still very alright. Just gotta keep an eye on the yearly increment.
GAB does not need to incur much spending on CAPEX (Capital expenditure). 31 million in 2011, which translate to 17.5% of net earnings. Depreciation is corresspondingly low.
GAB has a cash pile of 178 million and ZERO borrowings.
Due to its zero borrowings, I will not go into gearing ratios. Cos they will be err, zilch.
So, is GAB a cash cow? Lets look at its FCF (free cash flow). Free cash flow is Operating cash flow minus capex. FCF yield in 2011 is 5.36%, an increase of 40% from previous year. Nice.
ROE (Return on Equity) in 2011 is 35%, compared to peer Carlsberg 23% (FY 2010). Take caution when reading into this ratio, as it is affected by the debt level. Highly geared companies can have higher ROE. ROE is meaningful here as GAB has zero gearing.
So far, GAB looks pretty awesome doesn't it? It is obviously a solid and financially sound company. I'd love to own shares of it. But the big question, what is the right price to pay? I should be buying at fair value, or even better, when it is undervalued.
Let's dive into price ratios.
The most popular of all ratios, PE (Price over Earnings) Ratio.
On 22 Nov 2011, PE ratio of GAB is 17.69.
There is only 1 other comparable listed brewery, Carlsberg. PE of 16.67
Growth rate of GAB over 5 years is 7.19%
PEG (PE over growth) ratio is therefore 2.46.
More on PEG, read my previous post PEG Ratio
At the current price of RM10+, GAB is rather overpriced, in my opinion.
What is the fair price for GAB? I use Discounted Cash Flow (DCF) model. But seriously, don't rely too much on it as it has many variables. You know what they say, garbage in, garbage out. I adjust the calculations such as discount factor to my own comfort level. And I am conservative. Throw in all the numbers, and DCF regurgitates RM7.80. That is my number.
There is an excellent tutorial on DCF calculation on Investopedia. Comes with example to guide you through the whole process. If that's too much trouble, there are DCF calculators (usually in spreadsheets) that you can download from the Net.
In summary, I'd buy GAB for the long term, but not at this price. I'm anticipating a recession. Read Macro Outlook 15-Nov-2011. My chance will come.
Sunday, November 20, 2011
I am pro Fundamental Analysis, really!
It is starting to look like I'm a chartist, isn't it? I really am not. Just so happened that I have started to explore on Technical Analysis a little more. It sucks to watch my stocks fall right after I buy them. Ofcourse, Fundamental Analysis says that doesn't matter because it's for the long term, but if i can avoid buying at the worst points, such as strong resistance, why not.
When I started this blog, I wanted to write about companies listed in KLSE/Bursa which I may consider adding into my portfolio. Their fundamentals, pros n cons, a bit on technical and target prices. All of which that'll help me decide to grab or thrash.
A full write-up on a stock will take a long time. And most likely will deter me from ever finishing up. So, I'm gonna break it up into 3 parts; The Story, Fundamental Analysis and Technical Analysis.
The Story about a company is very important. If I can't tell a story about the company of the stock that I want to purchase, I do not go into it. I must be able to tell what the company does, what are its products/services, where are its presence, its growth prospects, market share, durable competitive advantages, its management and so much more. It's difficult to know much about the management as a retail investor. On this aspect, I mostly rely on financial ratios to gauge if its management delivers. And i avoid companies of notoriously shady management. You know, those who screw their shareholders over n over again. You know who they are...
There are so many stocks that I want to cover. So difficult to pick one to start with. So let's just go with something smooth, light, refreshing, full-flavored. You got it right, it's 'Time for a Tiger'. For the benefit of non-drinkers, my next post will be a story on Guinness Anchor Berhad (GAB). No ratios, no charts, just a story.
Wednesday, November 9, 2011
How to pick winning stocks? #1 PEG Ratio
I will write a series on my stock selection criteria, one at a time, in no particular order. #1 criteria does not mean the most important. They are ALL important!
My stock picking techniques are based on fundamental analysis. However, I inspect all 3 aspects of fundamental, technical and macroeconomy before making my buys.
#1 PEG Ratio
Previously, I have discussed about the PE Ratio.
From that discussion, the questions below arose:
Ahat about stocks that have single digit PE? Isn't that a bargain?
And does that hot stock deserve a PE of over 20?
Introducing the 'G' factor into the equation, GROWTH. PEG Ratio is PE over Growth.
PEG ratio of 1 is considered fair.
Less than 1 is undervalued.
More than 1 is overvalued.
Example:-
Using Dutch Lady (DLADY), let's start off with calculating its PE ratio.
Price: RM 20.84
Earnings per share, EPS : RM 0.9982
PE Ratio : Price/EPS
20.84/0.9982
20.87
For simplicity, let's take a round number of PE 21.
Scenario A
Assume DLADY average earnings growth : 21%
PEG ratio : PE/Growth
21/21
1
Thus, the share price of DLADY is deemed FAIR
Scenario B
Assume DLADY average earnings growth : 35%
PEG ratio : PE/Growth
21/35
0.6
Thus, the share price of DLADY is deemed UNDERVALUED
Scenario C
Assume DLADY average earnings growth : 7%
PEG ratio : PE/Growth
21/7
3
Thus, the share price of DLADY is deemed OVERVALUED
Actual Scenario
EPS growth of DLADY since 2007 average out to be 11%.

PEG ratio : PE/Growth
21/11
1.9
Buy when a share price is FAIR or UNDERVALUE. Translates into PEG Ratio of 1 or less.
Now, about that stock with PE ratio of over 20, say 25. With PEG ratio, we can decide if it is justifiable by check it's earnings growth. If it's growth has been phenomenal, growing at 30% for the past 3 years, that makes its PEG ratio less than 1, UNDERVALUE.
When checking for earnings growth, do look for consistent growth of 3 years or more. A spike in growth in mere 1-2 years isn't too reliable.
Subscribe to:
Posts (Atom)