Wednesday, November 30, 2011

Why did the markets jump 4%?

Look at the meteoric rise of the stock markets worldwide this week. Just yesterday, Dow Jones, S&P500 and Nasdaq all rose more than 4%. KLCI is already up by 27 points this morning, looking set to cross the 1500 line.

S&P 500 Daily Chart as at 30-Nov-2011

Source: Stockcharts.com

DJIA Daily Chart as at 30-Nov-2011

Source: Stockcharts.com

KLCI Daily Chart as at 1-Dec-2011

Source: Tradesignum.com\chart

Looking at these fantastic charts alone, I would have thought that EU leaders have finally found a grand solution to the Euro crisis and the US is out of recession risk. Not even close! What caused the uprise then?

#1 Coordinated action by six central banks to provide cheaper access to U.S. dollar funding
http://www.cnbc.com//id/45492184
http://www.businessinsider.com/fed-ecb-boj-boe-snb-bank-of-canada-announce-coordinated-intervention-2011-11

#2 China Cuts Reserve Ratio
http://www.bloomberg.com/news/2011-12-01/asian-stocks-advance-after-central-banks-ease-dollar-funding.html

What does the Lending Cost Cut and and Reserve Ratio Cut indicate?
#1 These arrangements should indicate just how frightened governments around the world are about the European financial crisis
http://online.wsj.com/article/SB10001424052970204012004577069960192509068.html?mod=asia_home

#2 China Reserve-Ratio Cut May Signal Slowdown
http://www.bloomberg.com/news/2011-11-30/china-cuts-reserve-requirement-for-banks-as-europe-crisis-threatens-growth.html

Does anyone care about the fall of PMI in China?
China Factory Sector Shrinks First Time in Nearly 3 Years
http://www.cnbc.com/id/45501162
China Manufacturing Falls for First Time Since 2009
http://www.bloomberg.com/news/2011-12-01/china-s-manufacturing-shrinks-for-first-time-since-2009-on-europe-impact.html

Or the Unsustainable yield that Italy has to pay for its government bond?
http://www.bloomberg.com/apps/quote?ticker=GBTPGR10:IND

Or that the Leading Indicators still points to recession risk in the US?
http://www.oecd.org/department/0,3355,en_2649_34349_1_1_1_1_1,00.html

Investors craves so much for a Santa rally that they put on rose tinted glasses while reading the news, picking only the good side of a report and brushing aside the rest.

When the reality that none of the crises have been resolved slaps them in the face, investors will go into another bout of panic selling. It's bound to happen isn't it?


KLSE FTSE Bursa Malaysia P/E on 30-Nov-2011

At Closing on 30-Nov-2011
KLCI Index : 1472.1
P/E Ratio     : 16.0779

Guinness Anchor Bhd, GAB – Technical Analysis


The third and final piece of my 3-part analysis of Guinness Anchor Berhad, which is also likely the most flawed. I’ve just begun my study of technical analysis (TA) and my analysis using TA will morph from time to time as I discover better ways. 

Long Term trend

GAB is trending upwards in the long term.
In this 5-year graph, I can also see that the 2008 global financial crisis didn’t have a severe impact on its stock price.

Simple Moving Average (SMA) & MACD
GAB is above its 20-day, 50-day and 200-day moving averages. Still bullish. But MACD tells a different story. MACD crosses below signal line and is hooking down. 

Support & Resistance
GAB is trading at the resistance of RM11. Immediately support is 10.60. Next level of support is the psychological price of RM10. Breaching this, it may retrace to 9.16

In Summary
At current price of near RM11, GAB is trading at resistance. Further upside is limited as GAB is deemed fully valued at PE of 17.7.

Read Part 1 and Part 2 of GAB Analysis here:

Tuesday, November 29, 2011

KLSE FTSE Bursa Malaysia P/E on 29-Nov-2011

At Closing on 29-Nov-2011
KLCI Index : 1444.72
P/E Ratio  :    15.7672

Monday, November 28, 2011

10-Year Historical Chart of FBM KLCI P/E Multiple


The daily KLCI updates I provide on this blog may not be too useful if one isn't aware of the historical value of the market PE.
More on historical KLCI PE info.

I'd so like to plot my own graph but I can't get my hands on KLCI PE 10 year data. Darn, I can't even get the past 1 year data! Doesn't seem to be published anywhere. Anyway, the chart provided by Public Mutual is quite accurate. Here is the latest available KLCI PE Multiple chart from Public Mutual.

Source: Public Mutual

On 18-Nov-2011, the PE ratio stated on the chart is 15.7x. A check with my own post on 18-Nov KLCI PE shows a multiple of 15.7986.

I've always been skeptical with mutual funds as they paint very rosy pictures of market conditions and investment returns. Reports and market data churnned out from mutual fund houses are likely to be sugar-coated and carefully selected to promote sales. I always check if the figures have been twisted to their benefit. Forward PE is one of them. I've heard enough of the market being extremely 'cheap' based to forward PE. Alright, back to the graph, the P/E on 2011 seem to aptly reflect the PE of the underlined date. Just forget about the P/E on 2012 earnings; now that is forward PE.

I will be making weekly posting on FTSE Bursa Malaysia KLCI Market P/E chart.

KLSE Bursa Malaysia KLCI P/E Multiple

KLSE Bursa Malaysia closed on 28-Nov-2011 to observe Awal Muharram.

KLSE Bursa FBM KLCI P/E Ratio

At Closing on 25-November-2011
KLCI Index : 1431.55
P/E Ratio  :    15.6234

Thursday, November 24, 2011

ChartNexus Technical Analysis Training Program Preview

Following the ChartNexus 3-hr Stock Screening Workshop I attended last week, I’ve returned for their 2-hr Program Preview last night. The trainer was the same one. I still didn’t catch his name, because he mumbles and blends his words. Frankly, if this is the trainer conducting the 4-day full seminar, I wouldn’t attend it even if I’m sold on Technical Analysis. How to tolerate 4 days of deciphering mumbles?  No offence to the trainer, I’m sure he’s highly skilled and qualified.
A short introduction on the history of ChartNexus, its products and he is ready to move on to the interesting bits.
3 Problems Traders Face
1.       What to Buy?
2.       When to Buy?
3.       When to Take Profit?
90% of Investors LOSE money in the stock market. Why?
1.       They are ignorant about ‘floor’ & ‘ceiling’
a.       Do not buy when price hits a resistance.
b.      Buy at support OR when it surpasses support

     2.       They buy because the stock is ‘cheap’.
                Cheap stocks can go cheaper.

3.       Missed opportunity. Don’t know how to cut loss
If I hung on to the losing stock above, I would have missed the opportunity to make a 100% gain on a winning stock in the same time frame. We should cut loss at 5%.

After showing us the charts that in retrospective, tells the obvious, he explained on how Technical Analysis can address the 3 problems traders face. What to buy, When to buy & When to Sell.

There are 3 Different Techniques for Different Market Conditions. Market has 3 directions; Up, Down & Sideways. By mastering Technical Analysis, traders can make profit in any market directions.

1.       Chart Pattern
a.       Ascending triangle
                                                               i.      Chart forming higher lows
                                                             ii.      Bullish signal, go long

b.      Descending triangle
                                                               i.      Chart forming lower highs
                                                             ii.      Bearish signal, go short

c.       Flag Formation
This kinda triangular flag it’s referring to, not the country flag sort
The flag formation is interesting because it comes with a profit target, which is the flag pole. We first draw the profit target = height of flag pole. Then we move it to the entry/buy point. Buy point is at the top of the flag pole. Exit point is therefore determined.
In the flag formation above, buy at 3.06 and sell at 3.22. 5.4% gain in just 3 days.

2.       Candlestick Pattern
a.       Doji
Bullish reversal pattern
Signals a reversal of trend. Tug of war in price

b.      Inverted Hammer
Bullish reversal pattern
Happens at low

c.       Bearish Engulfing
Signals end of uptrend


d.      Bullish engulfing
Signals end of downtrend


e.      Shooting star
      Long Upper Shadow
      Bearish
f.        Spinning Top
Short body, tails longer than body
Bearish

g.       Hammer
Bullish
Happens at low

h.         Hanging Man
 Hammer at resistance/top
 Bearish

3.       Indicators
20-Day MA, Bollinger band, MACD. The trainer didn’t explain much on indicators. In last week’s workshop, more emphasis was placed on indicators.

He then ended with Trading Plan,ESP, the key to profitable trading.
Entry
Stop loss
Profit target

*Source of all charts on this blog entry is from ChartNexus.

At the end of the seminar preview, I still wasn’t sold on the idea of trading using Technical Analysis. If reading chart patterns, candlesticks and indicators is all that is required for profitable trading, I might as well just buy a software that accurately spots all these and sets the E,S,P points for me. Why bother attending the 4-day program? ChartNexus actually sells an ESP software. But the point is, will I put my hard earned money on the table just because a software tell me to? I think not. Technical Analysis should never be used on its own but unfortunately, that is all ChartNexus program is about. Perhaps one day I may revisit ChartNexus program.


KLSE Bursa Malaysia KLCE P/E

At Closing on 24-November-2011
KLCI Index : 1447.99
P/E Ratio : 15.8353

Wednesday, November 23, 2011

Graph of KLSE/Bursa KLCI PE

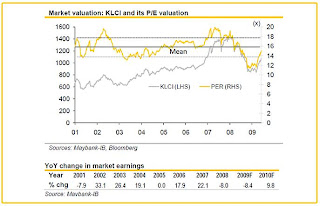
The market PE at current is about 16. And the average PE of KLCI is about 16. The market is neither undervalue nor overvalued at this point of time. But what if we fall  into a recession next year? How does KLCI PE look like in times of recession?


I've searched high and low for the historical graph of KLCI PE for a long time and found nothing. I'm looking for something similar to this, the S&P 500 PE Ratio graph:


Source: http://www.multpl.com/

I rejoiced when I chanced upon this report from Maybank-IB, which provided a graph of KLCI PE. However this report is rather outdated. And I just can't find a similar recent report from Maybank-IB.


Source:Maybank-IB

Then, Public Mutual sent me this in its newsletter. Here is the most recent Bursa KLCI PE graph in its 11-Nov-2011 newsletter.

Source: Public Mutual

The information in both sources are quite identical. Average PE of FTSE Bursa Malaysia KLCI is about 16x.

During the 2008-2009 global financial crisis, the PE fell to ~11. Just to illustrate how valuation of securities fall in tandem with the confidence of the general public in the share market.

The PE of KLCI tells us that Malaysians today are still quite confident of the market. Perhaps influenced by the impending general election and the promises of ETP's effectiveness.

I do not see any reason to enter the market at this point. The upside is limited but the downside is too huge to stomach.

KLSE Bursa KLCI PE Ratio

At Closing on 23-November-2011
KLCI Index : 1433.17
P/E Ratio  :    15.6976

Tuesday, November 22, 2011

Guinness Anchor Berhad, GAB - Fundamental Analysis


In  GAB The Story, I ended with the remark steady growth but nothing explosive. To illustrate this statement, I charted out the EPS(Earnings per share) and Revenue of GAB from 2006-2011. FYI, financial year end for GAB is 30-June.

So preditable that I can almost draw a straight line into future projection. Notice how the 2008 global financial crisis didn't hamper earnings.

Profit margin at 31% is decent. Carlsberg is at 30-ish% as well.
Operating expenses for SGA (Selling, general & administrative) rose 30% from previous year. At 49% of gross profit, SGA expense is still very alright. Just gotta keep an eye on the yearly increment.

GAB does not need to incur much spending on CAPEX (Capital expenditure). 31 million in 2011, which translate to 17.5% of net earnings. Depreciation is corresspondingly low.

GAB has a cash pile of 178 million and ZERO borrowings.
Due to its zero borrowings, I will not go into gearing ratios. Cos they will be err, zilch.

So, is GAB a cash cow? Lets look at its FCF (free cash flow). Free cash flow is Operating cash flow minus capex. FCF yield in 2011 is 5.36%, an increase of 40% from previous year. Nice.

ROE (Return on Equity) in 2011 is 35%, compared to peer Carlsberg 23% (FY 2010). Take caution when reading into this ratio, as it is affected by the debt level. Highly geared companies can have higher ROE. ROE is meaningful here as GAB has zero gearing.

So far, GAB looks pretty awesome doesn't it? It is obviously a solid and financially sound company. I'd love to own shares of it. But the big question, what is the right price to pay? I should be buying at fair value, or even better, when it is undervalued.

Let's dive into price ratios.
The most popular of all ratios, PE (Price over Earnings) Ratio.
On 22 Nov 2011, PE ratio of GAB is 17.69.
There is only 1 other comparable listed brewery, Carlsberg. PE of 16.67
Growth rate of GAB over 5 years is 7.19%
PEG (PE over growth) ratio is therefore 2.46.
More on PEG, read my previous post PEG Ratio
At the current price of RM10+, GAB is rather overpriced, in my opinion.

What is the fair price for GAB? I use Discounted Cash Flow (DCF) model. But seriously, don't rely too much on it as it has many variables. You know what they say, garbage in, garbage out. I adjust the calculations such as discount factor to my own comfort level. And I am conservative. Throw in all the numbers, and DCF regurgitates RM7.80. That is my number.
There is an excellent tutorial on DCF calculation on Investopedia. Comes with example to guide you through the whole process. If that's too much trouble, there are DCF calculators (usually in spreadsheets) that you can download from the Net.

In summary, I'd buy GAB for the long term, but not at this price. I'm anticipating a recession. Read Macro Outlook 15-Nov-2011. My chance will come.

Bursa/KLSE KLCI PE Ratio

At Closing on 22-November-2011
KLCI Index : 1437.99
P/E Ratio  :    15.6181

Monday, November 21, 2011

Guinness Anchor Berhad, GAB - The Story


GAB brews and sells beer, as simple as that. Its line up by category.
Beer
Tiger
Anchor
Heineken

Stout
Guinness

Premium Beer
Kilkenny
Paulaner
Strong bow
Sol

Malt & Shandy
Malta
Anglia

Tiger, Guinness, Heineken, Anchor, Kilkenney and Malta are brewed locally while Strongbow, Paulaner and Sol are imported.
The one closest to my heart, and gut, is Paulaner. Whoops, off topic.

GAB Bhd has presence only in Malaysia. No participation in regional markets via subsidiaries, unlike Carlsberg's model. However, GAB has the largest market share in Malt Liquor Market (MLM) locally at roughly 59%.

GAB is a dividend share, dishing out close to 90% of nett profit as dividends to shareholders. Dividend yield is 5% for FY2010 and FY2011. Better than FD at 3.x%. The share price is also doing extremely well. CAGR from 2007-2011 is 14.5%. If I had bought GAB in 2007 at 5.90 and held it till 2011, I would have gotten returns of ~19.5% annually. Fantastic.

GAB weathers recession really well. A strong defensive stock that was not affected by the 2008 great recession, in terms of revenue and profit.

Guinness Stout rules over Royal Stout, no contest about that. Volume of Guinness stout rose a mid-single digit in FY2011 but pubs/bars sales rose 20%, possibly indicating the younger crowd developing a taste for stout, an under-tapped segment.

In FY2011, Tiger volume rose by 10% and Heineken in mid teens.

GAB's new launches are Newcastle Brown Ale, an imported beer and new variant of Anglia Shandy, Orange and Grape.

Caveats
Malt Liquor Market (MLM) in Msia has not grown in the past 14 years. Consumption per capita actually decreased by CAGR -2.3% in the period from 2004-2009.Perhaps inline with the decrease of non-muslims in Msia.

Beer is slapped with very high excise duty. Highest in the region and 2nd highest in the world! We escaped a hike in 2011 but no guarantees for 2012. GAB’s percentage of excise duties to sales revenue is 50.4%

Gross profit margin has been flattish for the past 7 years.
Source: GAB Annual Report Year 2011


Wheat barley, key ingredient in brewing beer, is forecasted to rise 30-40% in Year 2012. Aluminium for canning is also expected to rise. Raw material and packaging costs accounts for 9.95% of revenue.GAB’s ties with Asia Pacific Brewery (APB), GAB's parent company, provide access to bulk purchases of key ingredients such as aluminium and wheat. Therefore, moderating some of the volatility in commodities. On this point, I'm not too worried as GAB has always been able to pass the cost down to consumers. Its most recent price hike was in 2011.

In Summary

GAB is a market leader, approximately 59% of market share. It has strong branding and loyal following. Consumers are unlikely to switch to a slightly cheaper product, unlike products like toilet-rolls. As a stock, it is low beta, dividend-paying stock and enjoys a steady appreciation in share price. Its biggest competitor is ofcourse, Carlsberg. In the premium beer segment, Starker by the 3rd player after GAB and Carlsberg puts up a good fight with OverTime pubs popping up like mushrooms all over Klang Valley.
GAB is good in many areas, but I search hard for a growth catalyst and fail to find one. I expect slow and steady growth, but nothing explosive.

KLSE KLCI PE Ratio

At Closing on 21-November-2011
KLCI Index : 1434.08
P/E Ratio     : 15.6209

Sunday, November 20, 2011

I am pro Fundamental Analysis, really!

It is starting to look like I'm a chartist, isn't it? I really am not. Just so happened that I have started to explore on Technical Analysis a little more. It sucks to watch my stocks fall right after I buy them. Ofcourse, Fundamental Analysis says that doesn't matter because it's for the long term, but if i can avoid buying at the worst points, such as strong resistance, why not.
When I started this blog, I wanted to write about companies listed in KLSE/Bursa which I may consider adding into my portfolio. Their fundamentals, pros n cons, a bit on technical and target prices. All of which that'll help me decide to grab or thrash.
A full write-up on a stock will take a long time. And most likely will deter me from ever finishing up. So, I'm gonna break it up into 3 parts; The Story, Fundamental Analysis and Technical Analysis.
The Story about a company is very important. If I can't tell a story about the company of the stock that I want to purchase, I do not go into it. I must be able to tell what the company does, what are its products/services, where are its presence, its growth prospects, market share, durable competitive advantages, its management and so much more. It's difficult to know much about the management as a retail investor. On this aspect, I mostly rely on financial ratios to gauge if its management delivers. And i avoid companies of notoriously shady management. You know, those who screw their shareholders over n over again. You know who they are...
There are so many stocks that I want to cover. So difficult to pick one to start with. So let's just go with something smooth, light, refreshing, full-flavored. You got it right, it's 'Time for a Tiger'. For the benefit of non-drinkers, my next post will be a story on Guinness Anchor Berhad (GAB). No ratios, no charts, just a story.

FTSE Bursa Malaysia KLCI Index PE Ratio

At Closing on 18-November-2011
KLCI Index : 1454.4
P/E Ratio     : 15.7986

Thursday, November 17, 2011

Free Charting Tools

Free charting tools are widely available on the Internet. Here  are a few that I use:
1. www.tradesignum.com/chart
2. www.chartnexus.com
3. finance.yahoo.com
4. http://marketwatch.weekendrush.com/charts/stocks/FBMKLCI.LS
Also, most brokerage provide free charting tools on their portal when you open an account with them. I am with hle by Hong Leong which I'm happy with so far.

FTSE Bursa Malaysia KLCI Index PE Ratio

At Closing on 17-November-2011
KLCI Index : 1465.47
P/E Ratio  :    15.867

Wednesday, November 16, 2011

ChartNexus 3-hr Stock Screening Workshop


ChartNexus 3-hr Stock Screening Workshop

ChartNexus runs this free 3-hour Stock Screening Workshop every Wednesday at their training center at Menara UOA, Bangsar. Location is strategic, adjoined with Bangsar LRT station. Since I chose to drive there, a raining night yesterday, I had to fork out RM7 for the parking. Whoa not cheap at all. 

Prerequisite to attending this workshop. You gotta have ChartNexus software installed on your laptop. And ofcourse, bring your laptop to the workshop as it is a practical session. You can download chartNexus for free. 

The trainer began the session by briefly running through the basic operations of ChartNexus Software. Pretty easy to use. It’s a breeze to draw trend lines and highlight turning points. Without further ado, he launched into the analysis of KLCI

FBM-KLCI

Looking at the 20-day moving average, KLCI is trending up. Uptrend is accompanied by increasing volume, which strengthens the pattern.
Support at 1466. If can break out of 1491 with high volume, KLCI can reach 1513, resuming uptrend.
Macd getting shorter. Wait for curve up.
Macd warning: going against the rise of klci, bearish divergence

Airasia

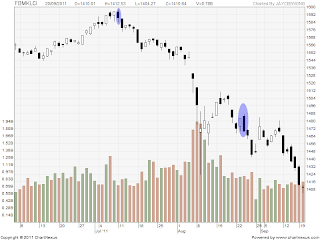
Airasia, on 23rd Sept 2011, trading out of Bollinger band, in a downtrend.
Hollow candle (oval highlight), buy signal. Filled candle(second oval highlight); sell.

Next, he introduced Xpert Trader, a paid module. With Xpert Trader, one can specify stock screening criteria. He demonstrated screening by Volume increase by 30% in the last trading day.

AMMB

At current, AMMB trading at lower Bollinger band. Good volume. Form bullish reversal pattern. Immediate resistance is 20-d MA. Risk-reward: buy at support 5.63, sell at resistance 5.83. It had formed a doji at support. Wait for green light from MACD. Green light means MACD bars turning from red to green. Somehow, MACD did not show up in the chart I captured. MACD bars for AMMB is red fyi.

Boustead

High volume. Doji is formed. Forming a Bollinger band squeeze. When stock moving on a sideways, Bollinger band is the best indicator.  Wait for breakout above 5.50.

Coastal

Bearish engulfing is observed. A filled candle engulfs previous day white candle (See oval highlight). It is also sitting on a resistance line of 1.99. Not a good time to buy. Immediate resistance is 20-Day average at 1.87. If it breaks below 20-d avg, it may retrace to 1.77

We also briefly went through a few other stocks in the same manner; using Bollinger band, resistance and support lines, 20-day MA, and break out points.
*Source of all charts in this entry is from ChartNexus software. 
 
Now, my view on the whole session. I am not big on Technical Analysis. I acknowledge its importance as it reflects investor’s psychology, the herding effect, but using it alone to pick stocks is unconvincing. The trainer makes stock selection too simplified. Buy here, sell there. Strangely, his muffled voice doesn’t sound like he means his buy n sell calls. 

However, learning a trick or two on Technical Analysis is beneficial. I’d still like to be able to detect a change of trend at KLCI; something more than just looking at 20-day MA and Bollinger bands. 

ChartNexus runs a full 4-day course on Technical Analysis charting from Friday-Tuesday. The cost is about RM5000. Honestly, if I have 5K to spend on seminar, I’d go for Milan Doshi’s property course. But that’s just me.


FTSE Bursa Malaysia KLCI Index PE Ratio

At Closing on 16-November-2011
KLCI Index : 1476.84
P/E Ratio  :    16.0059

Tuesday, November 15, 2011

Macro Outlook 15 November 2011


I'm no economist. My opinions on the macroeconomy are totally unqualified.
All my writings on macro outlook are based on the materials I read, and seminars/talks I attended.
I started out as a strong fundamental supporter; looking only at the fundamentals of the company. Dissect its balance sheet, P&L and cash flow statements. Look for economic moats, competitive advantages. Do not ever try to time the market because no one can and forget about technical analysis because it's tea leave reading.
Although I still strongly advocate Fundamental Analysis and use it for every stock purchase, I do not brush aside the macroeconomic factor. I do admit that I don't favor riding out a recession. I'd rather be in cash position and buy when valuation is cheap.

The Euro crisis.
There have been enough can kicking going on and half-baked solutions. Filter out the noise from Wall Street analysts who are desperate to hang on to every glimmer of hope. Let's look at the situation realistically.
Greece's sovereign debt problem is no where near being addressed. Harsh austerity imposed on Greece is pushing the country deeper into recession and killing its chance of growing.
ESFS is too small to build a ring fence around troubled nations. Not even the most complex financial engineering, boosting its fire-power to 1 trillion can help. Much of its funds is already committed to bailing out the PIGS (Portugal, Ireland, Greece, Spain). Bring in Italy, and ESFS looks more like a pea-shooter than the bazooka it is supposed to be.
Italy. It is too late. The Euro zone leaders have done too little too late to stem the contagion of PIGS debt crisis. The bond yield of Italy has reached a frightening level of >7%, shouting for a bail-out, if not for ECB stepping in to buy its bonds to bring down yields. It is now 6.76% yield for government 10-year bond. If it maintains at this level, Italy's debt is not sustainable. It cannot afford to roll over its debt at this rate for long.

Interest Rates, Inflation & QE
Interest rate in the US is already at near 0%. The Fed can't further lower rates to stimulate the economy.
Inflation (US), no thanks to QE 1 & 2, is at approximately 4%. A QE3 will further drive up inflation. When inflation flares, consumer confidence is affected as their spending power decreases.
US unemployment rate is stubbornly stuck at 9%.
Inflation in emerging economy powerhouses, China and India is high, over 6%. India has been increasing interest rates numerous times to stem inflation and dampening growth in the process. China, on the other hand, cannot be depended upon to stimulate a flagging economy, hoisting the world economy out of recession this time around as it will not simply embark on fiscal spending at such inflation level.

With Euro zone slipping into recession and US looking set to follow suit, I do not believe that Malaysia will not be affected, despite what our politicians say. Strong domestic demand, ETP.. all bull.. I'm not buying it. I'm bracing for an imminent downturn.

I shall end this post with a chart from OECD.

OECD composite leading indicators continue pointing to slowdown in economic activity
Source: oecd.org

FTSE Bursa Malaysia KLCI Index PE Ratio

At Closing on 15-November-2011
KLCI Index : 1477.22
P/E Ratio  :    16.037

Monday, November 14, 2011

KLCI Market Trend Using Technical Analysis

Technical analysis is my weakest among the 3 areas I look at for my stock investment. I don't use it to speculate in momentum stocks but more for a feel for the overall medium to long term trend. I use a few indicators but these may change as I find others which better serves me.

Here's a snapshot of KLCI over 1-year taken on 11-Nov-2011.
Source: Barchart and Tradesignum


1. Simple Moving Average, SMA
The most useful indicator of the lot.
SMA(50) line has not crossed SMA(200).
Price has broke about SMA(400) but is still below SMA(200).
Until the index convincingly break above the SMA(200) line at 1509, we are still not quite bullish yet.

2. Moving Avg Convergence Divergence (MACD)
MACD shows very bullish signs.
Both the signal lines are above the 0-mark with blue-line crossed over red-line.

3. Slow Stochastic Oscillator
Slow Stochastic Oscillator is strongly bullish.
Blue line crosses above 50-mark from 20-mark moving towards 80-mark

4. Parabolic SAR
Price is currently above Parabolic SAR. A buy sign.

It appears that 3 out of 4 indicators show bullish signs. However, I place higher importance on SMA and the fact that SMA(200) which is a very crucial line,has not been broken, makes it very difficult for me to be bullish. And this is looking at Technical indicators alone. Bring in the macroeconomics and I'm pushed back into the bear region. The best I can call the October upshot is a bear rally. Use this chance to exit long positions and hold tight to dear cash.